A queue is growing, exports are waiting, and the service appears to be running. There are several places to look: queue counts, consumers, connections, routing and application logs. The challenge is connecting those observations well enough to explain what is happening.
I want the AI to help gather that evidence and identify the next useful check. My rabbitmq skill gives the investigation a structure, starting with broker metadata and following the evidence into logs when needed.

Start with a specific question
The skill can investigate a named queue, survey backlogs, examine dead-letter routing or check broker health. This illustrative example uses the Claude Code command for my implementation:
/raholsn:rabbitmq sandbox why has the exports queue stopped making progress?If I do not yet know which queue needs attention, I can start more broadly:
/raholsn:rabbitmq sandbox list queues with a backlogThe first question goes directly to the named queue. The second uses a bounded, paginated survey and then checks interesting queues individually. The answer should identify how much of the requested scope was inspected, including any limits on the survey.
Before connecting, the skill resolves the environment, management endpoint and virtual host, or vhost. A queue name alone is not enough to identify the target across environments and vhosts. Those details should be visible in the answer so I can check where the evidence came from.
Compare observations over time
For a progress question, the skill captures at least two timestamped observations. It looks at ready and unacknowledged message counts, consumers, delivery and acknowledgement metrics where available, and relevant connection or channel state.
Suppose our illustrative export queue produces these snapshots:
| Observation | 09:00 UTC | 09:01 UTC |
|---|---|---|
| Ready messages | 120 | 145 |
| Unacknowledged messages | 0 | 0 |
| Consumers | 0 | 0 |
The backlog grew between observations, and neither snapshot showed a registered consumer. That gives us a concrete direction: establish whether the export consumer was expected to be active, then inspect its lifecycle and logs.
It does not yet explain why the consumer is absent. The service could be intentionally stopped, starting up, failing to subscribe or handling a cancellation incorrectly. Two snapshots also do not describe everything that happened between them.
If consumers were present and messages remained unacknowledged, the next questions would be different. We would need to examine delivery and acknowledgement activity alongside the application's processing time. A stable queue count alone would not tell us whether work was moving through it.
Missing metrics stay unknown. The assistant should not turn an absent field into a zero, or an unsuccessful API request into an empty queue.
Keep the evidence before changing the system
A restart may change the state we are trying to understand. I want the queue counts, consumer details, relevant policies and observation times captured before discussing recovery.
The skill records the broker version too. It uses management snapshots as evidence with a time and scope, without treating them as an atomic view of the whole system. For broker-health questions, it checks accessible alarms, partitions and resource pressure. A responding management API is only one part of that picture.
The investigation workflow
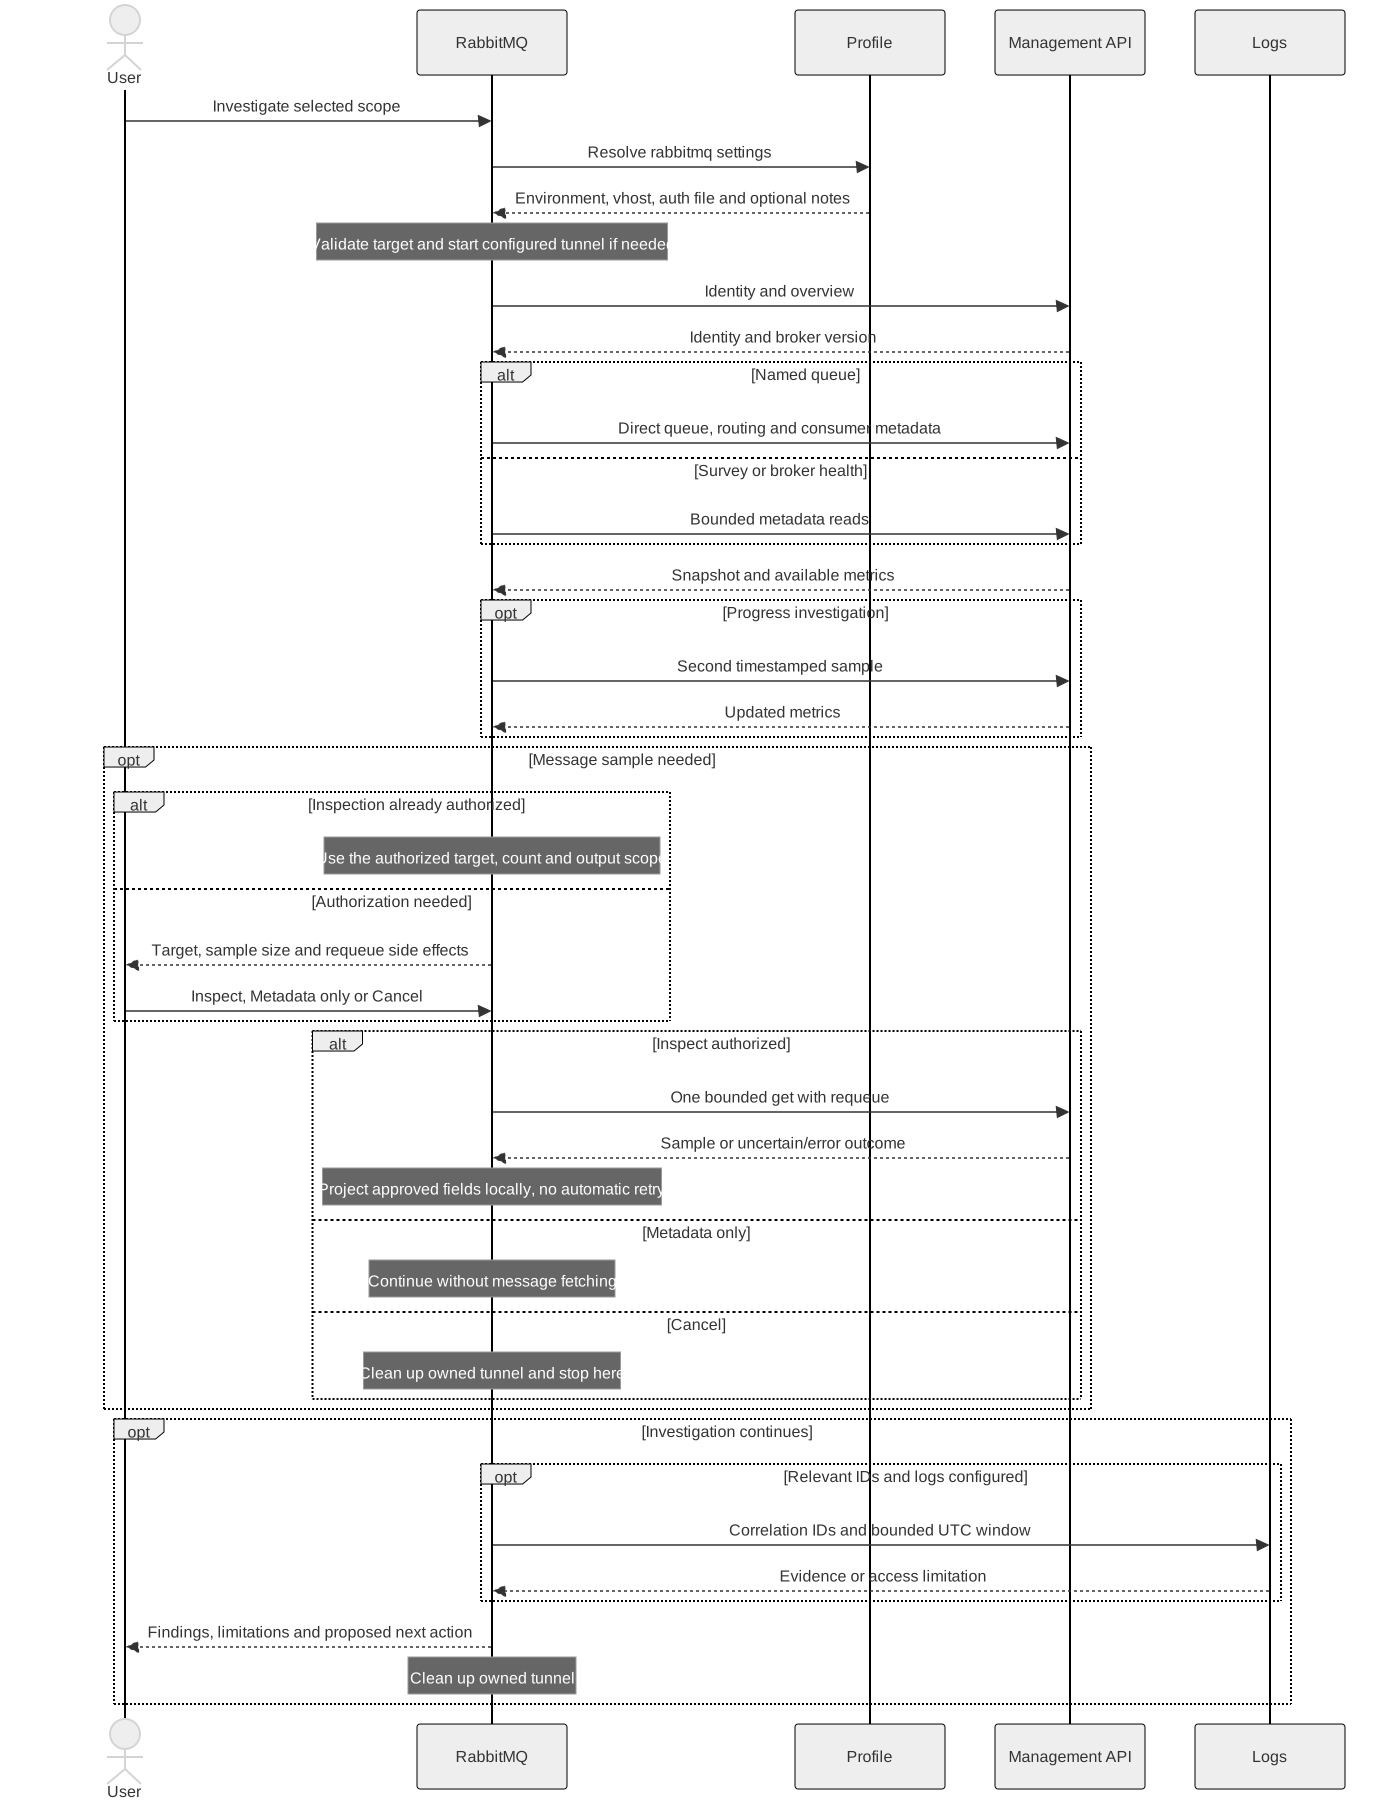
These diagrams describe the current skill instructions, not a recorded investigation.

Open the overview at full size
Explore metadata collection, message inspection and log correlation
The sequence shows where the skill compares observations, when message inspection needs a decision and how it follows relevant identifiers into logs.
Follow dead-letter routing before naming the cause
A queue called exports.dead is a useful candidate to investigate. The skill checks source queue arguments, policies and bindings to establish how messages reach it. The name is a convention, and applications may also publish directly to an error queue.
When an authorized message sample contains x-death headers, those can establish the source queue, exchange, reason, count and timestamps of broker dead-lettering. Reasons include rejection, expiry, exceeding a queue-length limit and reaching a quorum queue's delivery limit. RabbitMQ documents these fields in its dead-lettering reference.
Those fields describe a broker outcome. They do not supply the application exception or establish that a particular retry library exhausted its attempts.
If the evidence provides a correlation ID and logs are configured, the skill can hand that identifier and a bounded UTC window to the logs workflow. The header conventions come from the configured company notes or observed data.
For the export example, a matching application trace might explain what the worker was doing before it stopped making progress. If log access is unavailable, the broker findings still stand, while the application explanation remains unverified.
Fetching a message is a separate operation
Sometimes metadata and logs are enough. When the investigation needs a message sample, there is an additional decision to make.
The current implementation uses the management API's message-fetch endpoint with ack_requeue_true. That requests requeue after fetching, but it changes queue state. RabbitMQ describes this endpoint as intended for development and troubleshooting, and advises using messaging or streaming protocol clients in production. See the HTTP API reference.
The skill checks the queue type, broker version and effective delivery-limit policy before proposing a sample. Requeue should not be presented as a passive peek or a guarantee that delivery state will remain unchanged. Version matters here: RabbitMQ 4.3 changed which returns count toward quorum delivery limits, as explained in its poison-message handling documentation.
When inspection has not already been authorized within those bounds, the proposal names the exact target, count, payload truncation and fields to display, and explains the effects. I can choose Inspect, Metadata only or Cancel. Metadata only continues the investigation; Cancel ends it.
The defaults are a maximum of five messages and payload truncation at 4096 bytes. Displayed fields are limited separately. Fetching still retrieves payload data even if the assistant only returns selected metadata, so hiding the body in the answer does not make it a metadata-only request.
An uncertain fetch is not automatically retried. Repeated requeue samples may return the same messages, so they are not a way to page through the queue either.
Supply the connection through the profile
The company profile supplies RabbitMQ environments, management URLs, vhosts and the path to a protected authentication file. Credentials stay outside the profile and repository.
This implementation uses curl and jq against the management HTTP API. Basic or OAuth authentication uses the locally provisioned auth file; any company-specific login procedure belongs in the configured notes. There is no additional RabbitMQ MCP server bundled with the skill.
Some environments need a Kubernetes port-forward. The profile can provide that connection information, and the skill checks the tunnel before using it. It cleans up only a tunnel it started itself. Kubernetes is not required for a directly accessible endpoint.
This keeps the investigation method reusable while the workplace supplies the access details and queue conventions it cannot reliably infer.
Finish with findings and the next useful action
The result should make clear what was inspected, when it was observed and what the evidence supports. It includes any sampling scope, correlated logs, missing information and remaining hypotheses. By default, that is a conversational answer; a redacted report is saved when requested.
The investigation can inform recovery, but replay needs more context than a failed message. For an export, we may need to establish whether an earlier attempt already created a file or sent a notification, how duplicate work is handled and where the message should go. A transient error alone does not settle those questions.
The skill does not execute replay, purge, policy changes or restarts. It provides the evidence and a proposed next action for the operational workflow responsible for recovery.
The skill
You can find the rabbitmq skill on GitHub.
This article describes the workflow as of its updated date. The export queue and counts are illustrative, not results from a live broker investigation.
For me, the value is having help connect broker state to application behavior, with enough evidence to check the explanation. A useful answer can narrow the problem and show what to investigate next, even when the root cause is still open.
Happy coding!