Logs contain a lot of useful information, but connecting it takes work. Whether investigating an alert, checking unexpected behavior during development or following up on a reported issue, understanding what happened can mean tracing events across several services.
That digging can be time-consuming and demanding. Timestamps, retries and different identifiers all need to line up before individual log entries tell a coherent story.
AI can help with that work: finding relevant records, following identifiers and bringing related events into a timeline. I want it to highlight what deserves attention and show the supporting evidence, so I can assess the explanation and decide what to investigate next.
My logs skill gives that work a structure. It searches the configured telemetry store, follows request relationships where available and presents an answer with its search scope and limitations.
Start with the question
A support ticket might say:
The user tried to export their report around 09:05 UTC, but it never became available. User ID:
<user-id>. The error screen showed trace ID<trace-id>.
This is an illustrative ticket. It contains both the symptom and a starting point for the search. I can give that context to the assistant along with the environment and time window. This example uses the skill’s Claude Code command:
/raholsn:logs Investigate this support ticket in staging: the user's report export never became available around 09:05 UTC on March 19, 2026. Trace ID: <trace-id>. User ID: <user-id>. Search 09:00–09:15 UTC and correlate the relevant events across services.The identifiers are placeholders. If the ticket only has a user ID, the assistant can use it to find candidate requests within the time window, where that field is logged, then follow their trace or correlation IDs. One user may have several unrelated requests, so matching the user ID alone does not establish that every event belongs to the reported issue.
The command also supports questions that do not start with a particular request:
/raholsn:logs Find the slowest export-service requests in staging during the last hourThose are different investigations. The first needs the sequence of events for one request. The second needs duration data across matching operations, including ones that completed successfully. Filtering everything to errors would miss part of the question.
Connect the skill to the right telemetry
The current implementation uses Elastic Agent Builder through MCP. Elastic provides the connection and tools; the skill supplies the investigation method. The profile identifies the streams or indices to search, the field mappings and any local logging notes.
Elastic's Agent Builder and MCP reference architecture explains how its tools can be exposed to an MCP client. The deployment needs to support that connection and grant access to the relevant data. Adding an index name to a profile does not establish access by itself.
The skill checks the available tools and actual field mappings before querying. Different logging setups can represent the same concept differently, so it should not assume a field name or severity scale from a familiar-looking record.
This command uses read-only query and discovery tools. Investigating an incident does not authorize it to restart a service or change application data.
The workflow
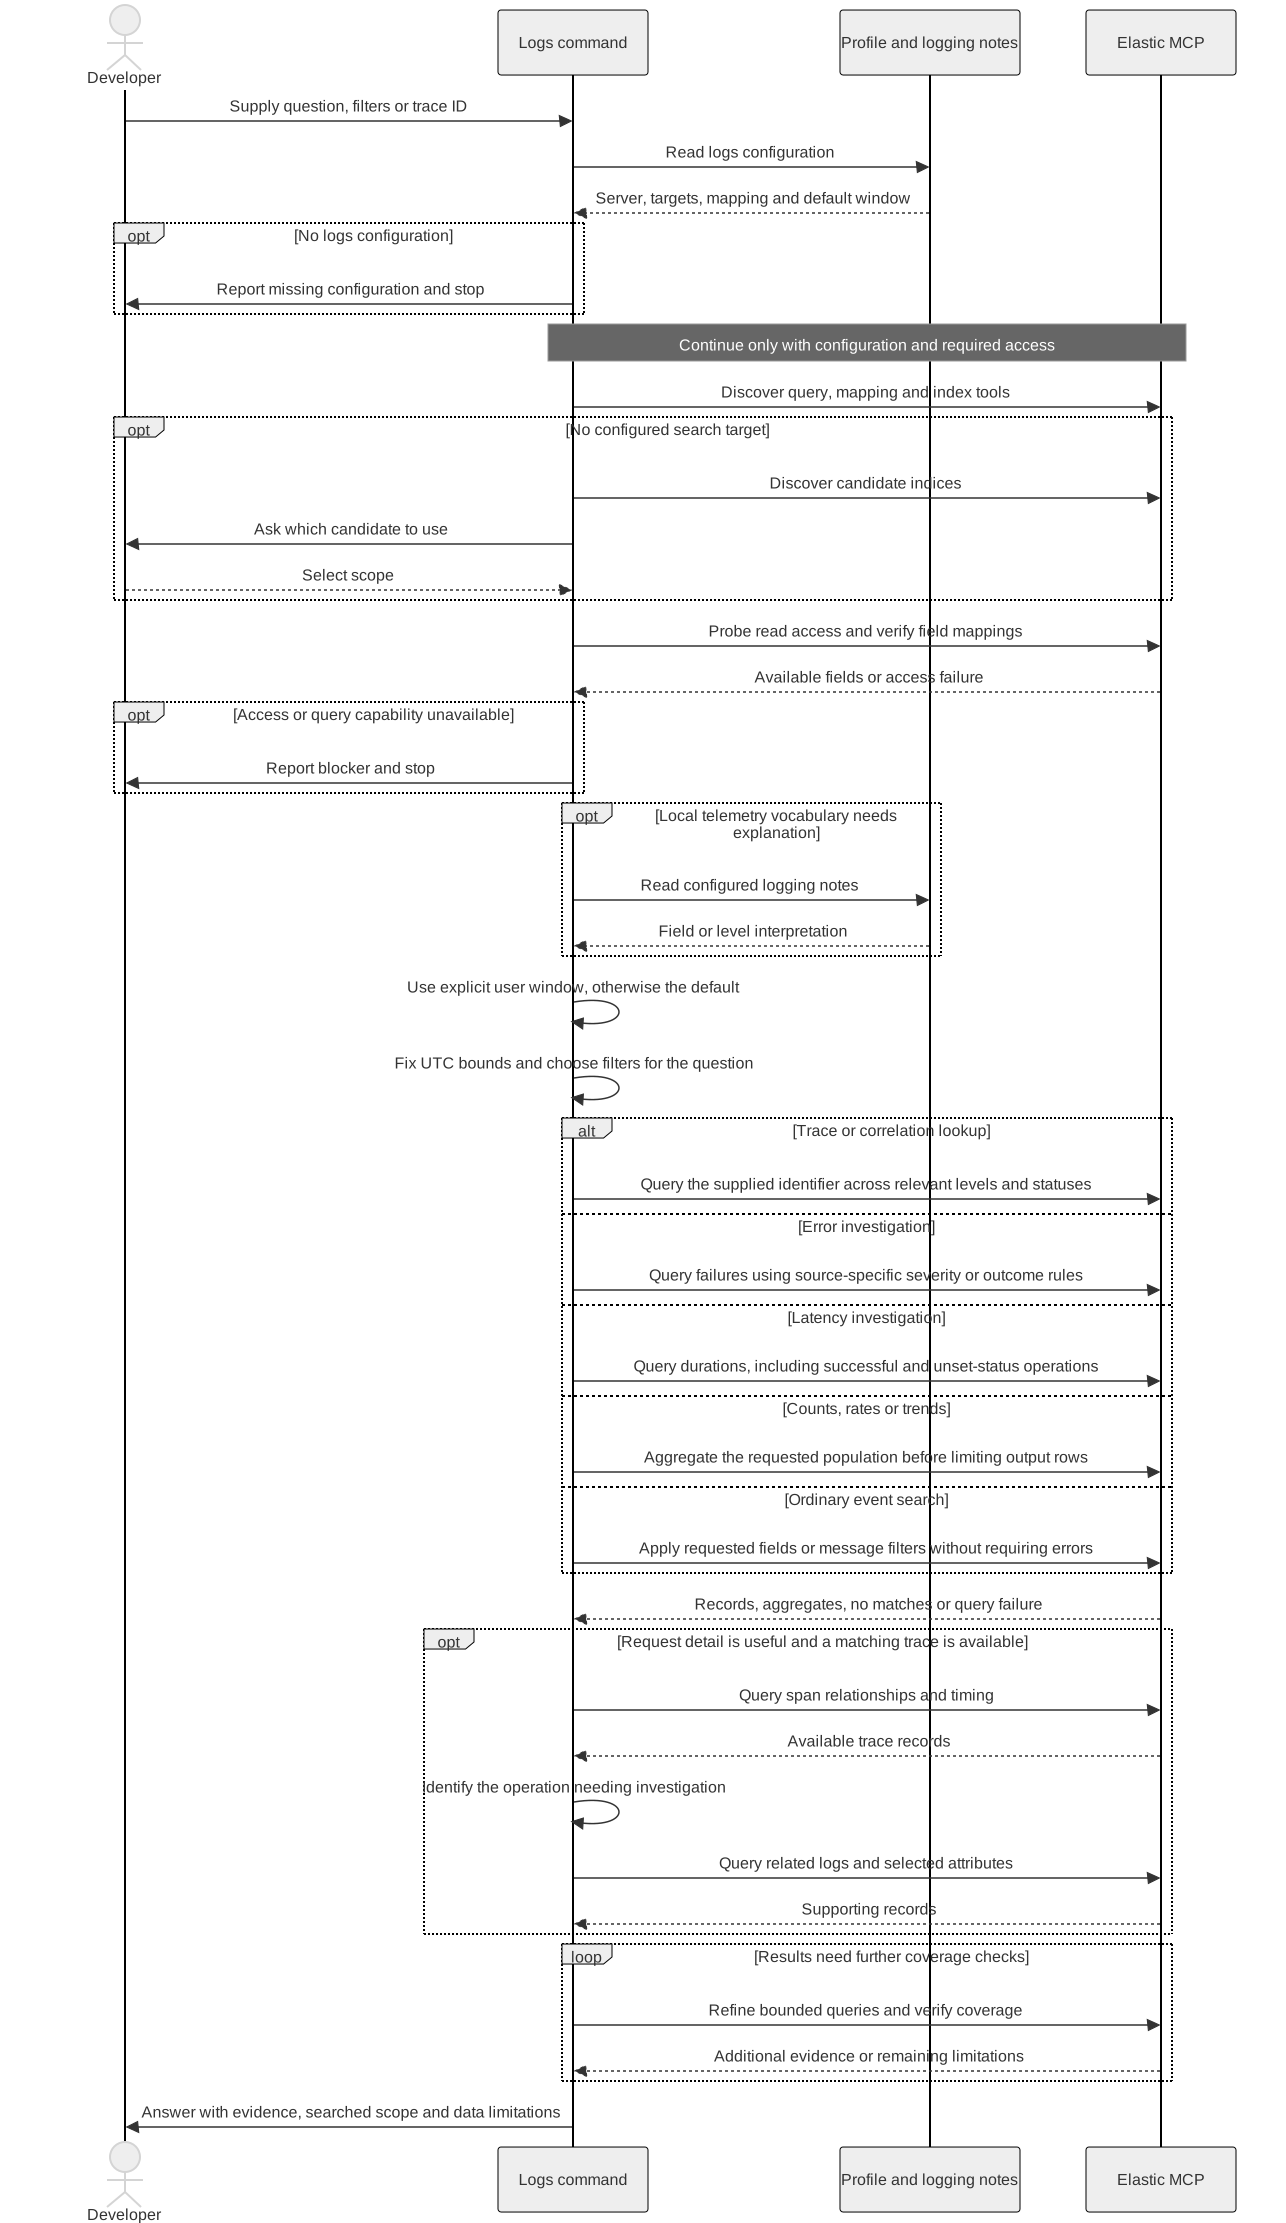
The investigation follows five steps:
- Establish the scope. Resolve the environment, telemetry target, time window and filters. Ask when the intended target is unclear.
- Check access and fields. Verify the connection and how the required data is represented.
- Query for the question. Choose a trace lookup, error search, latency query, aggregate or ordinary event search.
- Follow the relevant evidence. Inspect request relationships and associated logs when they help answer the question. Check for incomplete results.
- Present the answer. Show the supporting records or aggregates, explain the interpretation and identify the remaining limits.
Workflow diagram

Open the overview at full size
Explore the detailed workflow
The sequence shows how the query changes with the question and when the investigation follows a trace or refines its search.
The last error might be a symptom
Returning to the illustrative support ticket, suppose the API logs a timeout after calling a worker, and the worker has recorded a slow storage operation under the same trace.
A useful answer should establish the sequence before naming a cause. Did the storage operation start before the API timed out? Was the worker still processing afterward? Do the recorded durations account for the delay, or is there an unexplained gap?
The AI can use the available spans to outline the request path, then inspect the logs around the operation that needs attention. Instead of having to hold the whole sequence in my head while moving between searches, I can review the connected events, their timing and the records behind them. If span relationships are missing, it can still build a timeline from the matching records, but it should say that the call structure is incomplete.
Suppose the records show that the storage call occupied most of the time before the API timeout. That supports investigating the storage call. It does not, by itself, prove whether the underlying cause was throttling, networking or something in the application.
I want the answer to preserve that distinction. The evidence can tell us where to look next without settling the root cause yet.
Keep the search window consistent
“During the last hour” changes as time passes. The skill resolves that window once into fixed UTC bounds so its follow-up queries refer to the same period.
Sometimes a request continues outside the initial window, especially with asynchronous work. Following it further can be useful, but that wider search should be identified separately. It should not silently change a count I requested for the original period.
The selected indices matter just as much. No matches in the wrong environment tell us very little about the incident. A failed query is also different from a successful query with no results.
Counting errors is a different task
I can also ask for an aggregate:
/raholsn:logs Count export-service error events per minute in staging during the last hourFor that question, the skill should aggregate the matching events before limiting the rows returned to the conversation. Fetching a small sample and counting its errors would answer a different question.
It should also explain what was counted. One failed request might produce several error events across services, so an event count is not necessarily a count of failed requests.
When a tool truncates a response, the investigation needs to narrow or split its queries and check coverage. If completeness cannot be established, that remains part of the result.
What I want back
The answer should contain enough evidence for me to inspect the reasoning:
- The environment, stream and exact time window searched.
- The relevant records, identifiers and timing, or the requested aggregates.
- What those records support and what remains an interpretation.
- Missing data, truncation or access limitations that affect the conclusion.
I do not need every payload pasted into the conversation. I need the fields that matter and a clear path back to the relevant events.
The default result is an answer in the conversation. Unlike the implementation and review workflows, this skill does not require a saved Markdown report.
The skill
You can find the logs skill on GitHub.
The full instructions will live there, including the query and field-mapping rules. This article describes the workflow as of its updated date.
For me, the useful part is having help connecting the records while keeping the evidence visible. The AI can guide the investigation, but I still need to assess whether the explanation holds and what action the situation calls for.
Happy coding!